You can download and run the notebook locally or run it with Google Colaboratory:
![]()
Technical: Learning the temperature parameter#
This notebook demo will show how to use learnable temperature feature in CEBRA using rat hippocampus dataset.
Install note: be sure you have cebra, and the demo dependencies, installed to use this notebook:
[ ]:
!pip install --pre 'cebra[datasets,demos]'
[1]:
import sys

import numpy as np
import pandas as pd
import matplotlib.pyplot as plt
import joblib as jl
import cebra.datasets
from cebra import CEBRA

from matplotlib.collections import LineCollection
import pandas as pd
Load the data:#
The data will be automatically downloaded into a
/datafolder.
[2]:
hippocampus_pos = cebra.datasets.init('rat-hippocampus-single-achilles')
100%|██████████| 10.0M/10.0M [00:01<00:00, 9.19MB/s]
Download complete. Dataset saved in 'data/rat_hippocampus/achilles.jl'
[6]:
max_iterations = 5000
Fixed temperature model:#
temperature_modeis set toconstantby default, which uses a fixed temperature for a model.Initialize and train a model.
[9]:
cebra_fixed_temperature_model = CEBRA(model_architecture='offset10-model',
                        batch_size=512,
                        learning_rate=3e-4,
                        temperature_mode = 'constant',
                        temperature=1,
                        output_dimension=3,
                        max_iterations=max_iterations,
                        distance='cosine',
                        conditional='time_delta',
                        device='cuda_if_available',
                        verbose=True,
                        time_offsets=10)
[10]:
cebra_fixed_temperature_model.fit(hippocampus_pos.neural, hippocampus_pos.continuous_index)
fixed_temp_emb = cebra_fixed_temperature_model.transform(hippocampus_pos.neural)
_continuous_index
_discrete_index
delta
_seed
_seed
pos: 0.0898 neg: 5.4158 total: 5.5056 temperature: 1.0000: 100%|██████████████████████████████████████████████████████████████████████████████████████████████████| 5000/5000 [03:06<00:00, 26.83it/s]
[10]:
CEBRA(batch_size=512, conditional='time_delta', max_iterations=5000,
      model_architecture='offset10-model', output_dimension=3, temperature=1,
      time_offsets=10, verbose=True)
In a Jupyter environment, please rerun this cell to show the HTML representation or trust the notebook. On GitHub, the HTML representation is unable to render, please try loading this page with nbviewer.org.
CEBRA(batch_size=512, conditional='time_delta', max_iterations=5000,
      model_architecture='offset10-model', output_dimension=3, temperature=1,
      time_offsets=10, verbose=True)
Learnable temperature model:#
Setting
temperature_modetoautowill make the temperature to be optimized during the training of a model.min_temperatureis the lower bound for the tempearture. If not specified,min_temperatureis set to asymptotic 0.
[42]:
cebra_learnable_temperature_model = CEBRA(model_architecture='offset10-model',
                        batch_size=512,
                        learning_rate=3e-4,
                        temperature_mode = 'auto',
                        temperature=1,
                        min_temperature = 1e-1,
                        output_dimension=3,
                        max_iterations=max_iterations,
                        distance='cosine',
                        conditional='time_delta',
                        device='cuda_if_available',
                        verbose=True,
                        time_offsets=10)
[43]:
cebra_learnable_temperature_model.fit(hippocampus_pos.neural, hippocampus_pos.continuous_index)
learnable_temp_emb = cebra_learnable_temperature_model.transform(hippocampus_pos.neural)
_continuous_index
_discrete_index
delta
_seed
_seed
pos: 0.4400 neg: 4.2548 total: 4.6948 temperature: 0.2280: 100%|██████████████████████████████████████████████████████████████████████████████████████████████████| 5000/5000 [03:08<00:00, 26.58it/s]
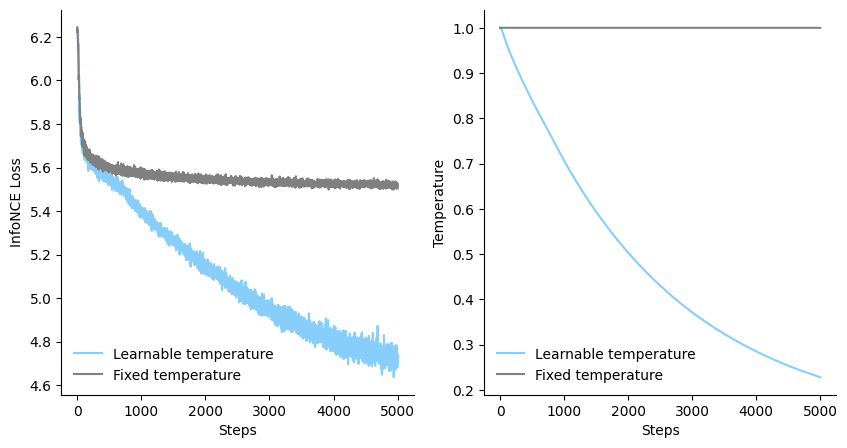
Visualize the loss and the temperature:#
[46]:
fig = plt.figure(figsize=(10,5))
ax1 = plt.subplot(121)
ax1.plot(cebra_learnable_temperature_model.state_dict_['loss'], c= 'lightskyblue', label='Learnable temperature')
ax1.plot(cebra_fixed_temperature_model.state_dict_['loss'], c='gray', label = 'Fixed temperature')
ax1.set_ylabel('InfoNCE Loss')
ax1.set_xlabel('Steps')
ax1.spines['top'].set_visible(False)
ax1.spines['right'].set_visible(False)
plt.legend(loc = 'lower left', frameon = False)
ax2= plt.subplot(122)
ax2.plot(cebra_learnable_temperature_model.state_dict_['log']['temperature'], c= 'lightskyblue', label='Learnable temperature')
ax2.plot(cebra_fixed_temperature_model.state_dict_['log']['temperature'], c='gray', label = 'Fixed temperature')
ax2.set_ylabel('Temperature')
ax2.set_xlabel('Steps')
ax2.spines['top'].set_visible(False)
ax2.spines['right'].set_visible(False)
plt.legend(loc = 'lower left', frameon = False)
[46]:
<matplotlib.legend.Legend at 0x7f00064b4fd0>
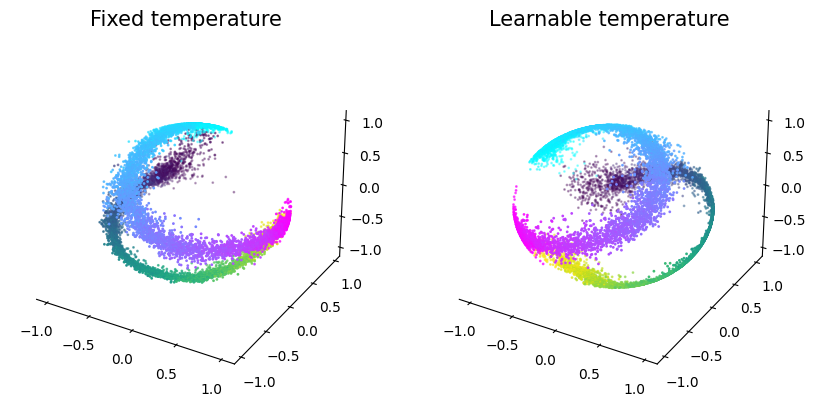
Visualize the embeddings from the models#
[47]:
def plot_hippocampus(ax, embedding, label):
    r_ind = label[:,1] == 1
    l_ind = label[:,2] == 1

    ax.scatter(embedding [r_ind,0],
               embedding [r_ind,1],
               embedding [r_ind,2],
               c=label[r_ind, 0],
               cmap='cool', s=1)
    ax.scatter(embedding [l_ind,0],
               embedding [l_ind,1],
               embedding [l_ind,2],
               c=label[l_ind, 0],
               cmap='viridis', s=1)

    ax.grid(False)
    ax.xaxis.pane.fill = False
    ax.yaxis.pane.fill = False
    ax.zaxis.pane.fill = False
    ax.xaxis.pane.set_edgecolor('w')
    ax.yaxis.pane.set_edgecolor('w')
    ax.zaxis.pane.set_edgecolor('w')
    return ax
[50]:
fig=plt.figure(figsize=(10,5))
ax1 = plt.subplot(121, projection = '3d')
ax1=plot_hippocampus(ax1, fixed_temp_emb, hippocampus_pos.continuous_index)
ax1.set_title('Fixed temperature', fontsize=15)
ax2 = plt.subplot(122, projection = '3d')
ax2=plot_hippocampus(ax2, learnable_temp_emb, hippocampus_pos.continuous_index)
ax2.set_title('Learnable temperature', fontsize=15)
[50]:
Text(0.5, 0.92, 'Learnable temperature')