You can download and run the notebook locally:
Extended Data Figure 7: Multi-session training and rapid decoding#
import plot and data loading dependencies#
[1]:
import numpy as np
import pandas as pd
import matplotlib.pyplot as plt
from matplotlib.lines import Line2D
import seaborn as sns
import joblib as jl
import matplotlib.pyplot as plt
import numpy as np
import seaborn as sns
from matplotlib.markers import MarkerStyle
Define data loading & functions#
[2]:
def recover_python_datatypes(element):
    if isinstance(element, str):
        if element.startswith("[") and element.endswith("]"):
            if "," in element:
                element = np.fromstring(element[1:-1], dtype=float, sep=",")
            else:
                element = np.fromstring(element[1:-1], dtype=float, sep=" ")
    return element


def figure():
    plt.figure(figsize=(2, 2), dpi=200)
Define metric functions#
[3]:
def mean(v):
    return sum(v) / len(v)


def sort_results(metrics, full_metrics, results):

    sorted_results = results.copy()
    sorted_results["seed"] = -1
    idx = sorted_results.pivot_table("logdir", index=full_metrics, aggfunc="count")
    sorted_results = sorted_results.set_index(full_metrics)
    for i in idx.T:
        sorted_results.loc[i, "seed"] = np.arange(10)

    sorted_results.groupby(full_metrics)["seed"].apply(tuple).apply(
        lambda v: v == tuple(range(10))
    ).all().all()
    return sorted_results.reset_index()


import pandas as pd

metrics = [
    "batch_size",
    "conditional",
    "delta",
    "device",
    "learning_rate",
    "loss_distance",
    "model",
    "num_hidden_units",
    "num_output",
    "num_steps",
    "save_emissions",
    "save_frequency",
    "share_model",
    "temperature",
    "time_offset",
    "tqdm",
    "train_ratio",
    "valid_frequency",
    "valid_ratio",
    "variant",
    "repeat",
    "steps",
]
full_metrics = metrics + ["data_mode"]
results = pd.read_csv("../data/Figure4SupplementMultisession_rat.csv").applymap(
    recover_python_datatypes
)

sorted_results = sort_results(metrics, full_metrics, results)
/tmp/ipykernel_852782/2666736443.py:12: PerformanceWarning: indexing past lexsort depth may impact performance.
  sorted_results.loc[i, "seed"] = np.arange(10)
Load and check metrics#
[4]:
aggregated_metrics = [m for m in full_metrics if m not in ["repeat", "seed"]]
aggregated_results = sorted_results.groupby(aggregated_metrics).agg(mean).reset_index()
aggregated_results.columns

idx = (
    aggregated_results[aggregated_results.data_mode == "single-session"]
    .sort_values("train_consistency")
    .groupby("data_mode")
    .tail(1)
    .set_index(aggregated_metrics)
    .index
)
sorted_results.set_index(aggregated_metrics).loc[idx].reset_index().groupby(
    aggregated_metrics + ["seed"]
).mean().reset_index().to_csv("cebra-behavior.csv")
/tmp/ipykernel_852782/495670736.py:2: FutureWarning: Dropping invalid columns in DataFrameGroupBy.agg is deprecated. In a future version, a TypeError will be raised. Before calling .agg, select only columns which should be valid for the function.
  aggregated_results = sorted_results.groupby(aggregated_metrics).agg(mean).reset_index()
[5]:
def compute(sorted_results):
    sorted_results = sorted_results.copy()
    sorted_results["mean_train_consistency"] = sorted_results[
        "train_consistency_raw"
    ].apply(np.mean)

    groupby = [m for m in metrics if m != "repeat"] + ["data_mode"]
    sorted_results

    sorted_results = sorted_results[
        (sorted_results.num_hidden_units == 32) & (sorted_results.steps == 5000)
    ].explode("test_position_error_raw")

    sorted_results["animal"] = np.arange(len(sorted_results)) % 4
    return sorted_results


result = (
    compute(sorted_results)
    .pivot_table(
        "test_position_error_raw",
        index=("data_mode", "animal"),
        columns="seed",
        aggfunc="mean",
    )
    .agg(list, axis=1)
    .unstack()
    .T
)
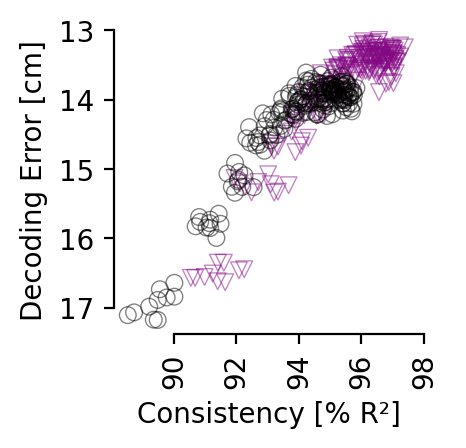
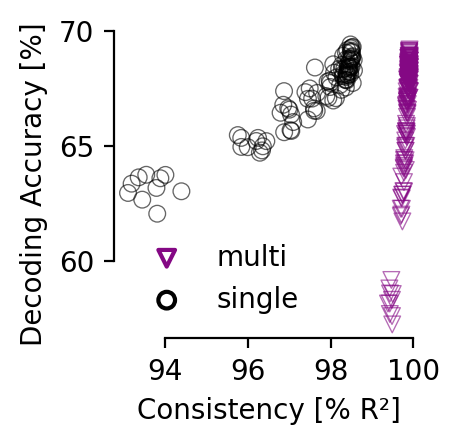
Comparison of decoding vs. consistency#
Define plotting function
Comparison of decoding metrics for single or multi-session training at various consistency levels (averaged across all 12 comparisons). Models were trained for 5,000 (single) or 10,000 (multi-session) steps with a 0.003 learning rate; batch size was 7,200 samples per session. Multi-session training requires longer training or higher learning rates to obtain the same accuracy due to the 4-fold larger batch size, but converges to same decoding accuracy. We plot points at intervals of 500 steps (n=10 seeds); training progresses from lower right to upper left corner within both plots.
[6]:
def plot_hippocampus(sorted_results, metric, yaxis):

    filtered_results = (
        sorted_results[
            (sorted_results.num_hidden_units == 32)
            & (sorted_results.num_output == 32)
            & (sorted_results.steps > 100)
            & (sorted_results.steps < 5000)
        ]
        .set_index("data_mode")
        .sort_values("valid_position_error")
        .groupby(["steps", "data_mode", "seed", "repeat", "num_output"])
        .head(1)
    )
    filtered_results = filtered_results[filtered_results.steps % 250 == 0]
    filtered_results["train_consistency"] *= 100
    filtered_results["test_position_error"] *= 100
    filtered_results = filtered_results.groupby(["steps", "data_mode", "seed"]).mean()
    # display(filtered_results.reset_index().steps.value_counts())

    plt.figure(figsize=(2, 2), dpi=200)
    sns.scatterplot(
        data=filtered_results.reset_index().sort_values("data_mode"),
        x="train_consistency",
        y="test_position_error",
        style="data_mode",
        hue="data_mode",
        palette=["#840884", "k"],
        markers=[MarkerStyle("v", "none"), MarkerStyle("o", "none")],
        alpha=0.5,
        ci=None,
        legend=False,
    )

    plt.legend(loc=(1, 0), frameon=False)
    plt.xlabel("Consistency [% R²]")

    plt.xticks([90, 92, 94, 96, 98])

    sns.despine(trim=True)
    plt.ylabel(yaxis)
    plt.xlabel("Consistency [% R²]")

    plt.xticks(rotation=90)
    plt.gca().invert_yaxis()
    plt.show()


from matplotlib.markers import MarkerStyle


def plot_allen(results):
    def add_seed(line):
        line["seed"] = np.arange(10)
        return line

    traj_results = results.groupby(["data_mode", "repeat", "steps"]).apply(add_seed)
    traj_results = (
        traj_results.groupby(["data_mode", "seed", "steps"]).apply("mean").reset_index()
    )
    traj_results = (
        traj_results.set_index("data_mode").drop("time-contrastive").reset_index()
    )
    traj_results.train_consistency *= 100
    traj_results = traj_results[traj_results.steps % 500 == 0]
    traj_results.data_mode = traj_results.data_mode.apply(
        {"multi-session": "multi", "single-session": "single"}.get
    )

    plt.figure(figsize=(2, 2), dpi=200)
    sns.scatterplot(
        data=traj_results[["data_mode", "steps", "test_accuracy", "train_consistency"]],
        x="train_consistency",
        y="test_accuracy",
        style="data_mode",
        hue="data_mode",
        palette=["#840884", "k"],
        markers=[MarkerStyle("v", "none"), MarkerStyle("o", "none")],
        # s = 10,
        alpha=0.6,
        ci=None,
    )
    plt.xlabel("Consistency [% R²]")
    plt.ylabel("Decoding Accuracy [%]")
    plt.xticks([94, 96, 98, 100])
    sns.despine(trim=True)
    plt.legend(frameon=False)
    plt.show()


plot_hippocampus(
    sorted_results, metric="test_position_error", yaxis="Decoding Error [cm]"
)

allen_results = pd.read_hdf("../data/EDFigure7/allen-consistency.h5", key="allen")
plot_allen(allen_results)
No artists with labels found to put in legend. Note that artists whose label start with an underscore are ignored when legend() is called with no argument.
consistency matrix single vs. multi-session training for hippocampus (32D embedding) and Allen data (128D embedding) respectively.#
Consistency is reported at the point in training where the average position decoding error is less than 14 cm (corresponds to 7 cm error for rat 1), and a decoding accuracy of 60% on the Allen dataset.
[7]:
def show_sweep(df):
    for c in df.columns:
        try:
            values = df[c].unique()
        except TypeError:
            continue
        # if len(values) != len(df):
        if len(values) > 1:
            print(c, values)


filtered_results = aggregated_results[
    (aggregated_results.batch_size == 512)
    & (aggregated_results.learning_rate == 0.0003)
    & (aggregated_results.num_output == 32)
    & (aggregated_results.num_hidden_units == 32)
].set_index("data_mode")

filtered_results = filtered_results[filtered_results["valid_position_error"] < 0.14]
display(
    filtered_results.sort_values("valid_position_error")["valid_position_error"]
    .groupby("data_mode")
    .tail(1)
)
filtered_results = (
    filtered_results.sort_values("valid_position_error").groupby("data_mode").tail(1)
)

print("Rat hippocampus dataset")
_, axes = plt.subplots(2, 2, figsize=(4, 4), dpi=200)

for ax_row, data_mode in zip(axes, ["single-session", "multi-session"]):

    for ax, split in zip(ax_row, ["train"]):

        values = filtered_results[f"{split}_consistency_raw"].loc[data_mode]

        cfm = np.zeros((4, 4))
        cfm[:] = float("nan")
        cfm[~np.eye(4).astype(bool)] = values
        sns.heatmap(
            cfm * 100,
            cmap="gray_r",
            vmin=50,
            vmax=100,
            annot=True,
            fmt=".1f",
            square=True,
            cbar=False,
            ax=ax,
        )

for ax in axes.flatten():
    ax.axis("off")

plt.subplots_adjust(wspace=-0.005, hspace=0.05)
plt.show()
data_mode
multi-session     0.139947
single-session    0.139954
Name: valid_position_error, dtype: float64
Rat hippocampus dataset

[8]:
def agg(values):
    if values.name.endswith("_raw"):
        return np.stack(values, axis=0).mean(axis=0)
    return values.mean()


def show_sweep(df):
    for c in df.columns:
        try:
            values = df[c].unique()
        except TypeError:
            continue
        # if len(values) != len(df):
        if len(values) > 1:
            print(c, values)


def filter_results(results):
    results_ = (
        results.groupby([c for c in metrics + ["data_mode"] if c != "repeat"])
        .agg(agg)
        .reset_index()
    )
    filtered_results = results_[
        (results.batch_size == 7200)
        & (results.learning_rate == 0.003)
        & (results.num_output == 128)
        & (results.num_hidden_units == 128)  # &
    ].set_index("data_mode")

    filtered_results = filtered_results[filtered_results["valid_accuracy"] > 60]
    filtered_results = (
        filtered_results.sort_values("valid_accuracy").groupby("data_mode").head(1)
    )  # ["valid_accuracy"]
    # close to 60% accuracy
    # filtered_results["valid_accuracy"]
    return filtered_results


def plot_consistency_allen(filtered_results):
    _, axes = plt.subplots(2, 1, figsize=(4, 4), dpi=200)

    for ax, data_mode in zip(axes, ["single-session", "multi-session"]):

        split = "train"
        values = filtered_results[f"{split}_consistency_raw"].loc[data_mode]

        cfm = np.zeros((4, 4))
        cfm[:] = float("nan")
        cfm[~np.eye(4).astype(bool)] = values
        sns.heatmap(
            cfm * 100,
            cmap="gray_r",
            vmin=50,
            vmax=100,
            annot=True,
            fmt=".1f",
            square=True,
            cbar=False,
            ax=ax,
        )
        ax.axis("off")

    plt.subplots_adjust(wspace=-0.005, hspace=0.05)
    plt.show()


allen_results = pd.read_hdf("../data/EDFigure7/allen-consistency.h5", key="allen")
filtered_results_allen = filter_results(allen_results)
print("Allen dataset")
plot_consistency_allen(filtered_results_allen)
/tmp/ipykernel_852782/1272793558.py:20: FutureWarning: Dropping invalid columns in DataFrameGroupBy.agg is deprecated. In a future version, a TypeError will be raised. Before calling .agg, select only columns which should be valid for the function.
  results.groupby([c for c in metrics + ["data_mode"] if c != "repeat"])
Allen dataset
/tmp/ipykernel_852782/1272793558.py:24: UserWarning: Boolean Series key will be reindexed to match DataFrame index.
  filtered_results = results_[

[9]:
filtered_results[f"train_consistency_raw"].loc["multi-session"], filtered_results[
    f"train_consistency_raw"
].loc["single-session"]
[9]:
(array([0.95081546, 0.91219784, 0.97159572, 0.9668054 , 0.89214698,
        0.95330396, 0.93798715, 0.90619733, 0.92378746, 0.97700708,
        0.93911369, 0.90545486]),
 array([0.95555933, 0.88572262, 0.97200465, 0.9593825 , 0.84737061,
        0.94094321, 0.93445153, 0.90453392, 0.92011637, 0.97647199,
        0.94380083, 0.87852935]))
Statistics#
[10]:
import scipy.stats

scipy.stats.ttest_rel(
    filtered_results[f"train_consistency_raw"].loc["multi-session"],
    filtered_results[f"train_consistency_raw"].loc["single-session"],
    alternative="greater",
)
[10]:
Ttest_relResult(statistic=2.2233272445184493, pvalue=0.024042329397411348)
Accuracy on train, validation, and test sets:#
[11]:
def _select(values):
    index, values = values[0], values[1:]
    return values[index]


def hyperparameter_pivot(
    data, select_with, metric, index=[], columns=[], select_func=np.argmin
):

    idx = data.pivot_table(
        select_with, index=index, columns=columns, aggfunc=lambda v: (select_func(v),)
    )

    agg = data.pivot_table(metric, index=index, columns=columns, aggfunc=tuple)

    if len(agg.columns) == 1:
        idx.columns = [metric]
        agg.columns = [metric]

    return (idx + agg).applymap(_select)


from IPython.display import display, HTML

KEYS = (
    "train_consistency",
    "valid_consistency",
    "test_consistency",
    "valid_position_error",
    "test_position_error",
)


def show_results(select_by="valid_accuracy", func=np.argmax, keys=KEYS):

    frames = (
        hyperparameter_pivot(
            results,
            select_by,
            key,
            index=["data_mode"],
            columns=["batch_size"],
            select_func=func,
        )
        * (100 if "consistency" in key else 1)
        for key in keys
    )

    titles = [
        "Consistency (R², train)",
        "Consistency (R², valid)",
        "Consistency (R², test)",
        "Accuracy (valid)",
        "Accuracy (test)",
    ]

    # summary = pd.concat(frames, axis = 1)
    # summary.columns = titles
    # return HTML(summary.style.format(precision = 2)._repr_html_())

    return HTML(
        ("\xa0" * 3).join(
            frame._repr_html_() + title for frame, title in zip(frames, titles)
        )
    )


select_metrics = ("valid_total_r2",)
for key in select_metrics:
    display(show_results(key))
    print("selected by best", key)

#
| train_consistency | |
|---|---|
| data_mode | |
| multi-session | 95.259507 |
| single-session | 94.677608 |
| valid_consistency | |
|---|---|
| data_mode | |
| multi-session | 84.270572 |
| single-session | 82.158812 |
| test_consistency | |
|---|---|
| data_mode | |
| multi-session | 89.312167 |
| single-session | 85.715708 |
| valid_position_error | |
|---|---|
| data_mode | |
| multi-session | 0.124064 |
| single-session | 0.127632 |
| test_position_error | |
|---|---|
| data_mode | |
| multi-session | 0.126732 |
| single-session | 0.128096 |
selected by best valid_total_r2
Load data for Fine-tuning on unseen subject experiments, and define plotting code#
[12]:
data = pd.read_hdf("../data/EDFigure7.h5")
[13]:
def one_rat(ax, rat_no, rat_df):
    adapt_reinit = [True, False]
    adapt_tune_all = [True, False]

    for reinit in adapt_reinit:
        for tune_all in adapt_tune_all:
            if reinit:
                c = "gray"
            else:
                c = "purple"  # (0, (5, 10))
            if tune_all:
                ls = "solid"
            else:
                ls = "dashed"
            exp_type = rat_df[
                (rat_df["adapt_reinit"] == reinit)
                & (rat_df["adapt_tune_all"] == tune_all)
            ]
            ax.plot(
                np.arange(int(steps / 25)),
                np.array(eval(exp_type["median_err"].item()))[: int(steps / 25)] * 100,
                linestyle=ls,
                color=c,
                lw=3,
            )
            ax.set_title(f"Rat {rat_no+1}", fontsize=20)
            ax.spines["right"].set_visible(False)
            ax.spines["top"].set_visible(False)

            ax.set_ylabel("Median Error (cm)", fontsize=30)
            ax.set_xlabel("Adaptation steps", fontsize=30)
            ax.set_xticks(xticks / 25)
            ax.set_yticks(yticks)
            ax.set_yticklabels(yticks, fontsize=25)
            ax.set_xticklabels(xticks, fontsize=25)


def plot(rat_df):

    fig = plt.figure(figsize=(7, 7))
    plt.subplots_adjust(wspace=0.5, hspace=0.5)
    ax = plt.subplot(111)
    rat = 3
    plt.yticks(fontsize=25)

    one_rat(ax, rat, rat_df)

    custom_lines = [
        Line2D([0], [0], color="gray", lw=4),
        Line2D([0], [0], color="purple", lw=4),
        Line2D([0], [0], color="black", lw=4, ls="solid"),
        Line2D([0, 2], [0, 0], color="black", lw=4, ls="dashed"),
    ]

    ax.legend(
        custom_lines,
        [
            "From scratch",
            "Pre-trained",
            "Full model",
            "Input embedding",
        ],
        loc=(1.2, 0),
        frameon=False,
        fontsize=30,
    )
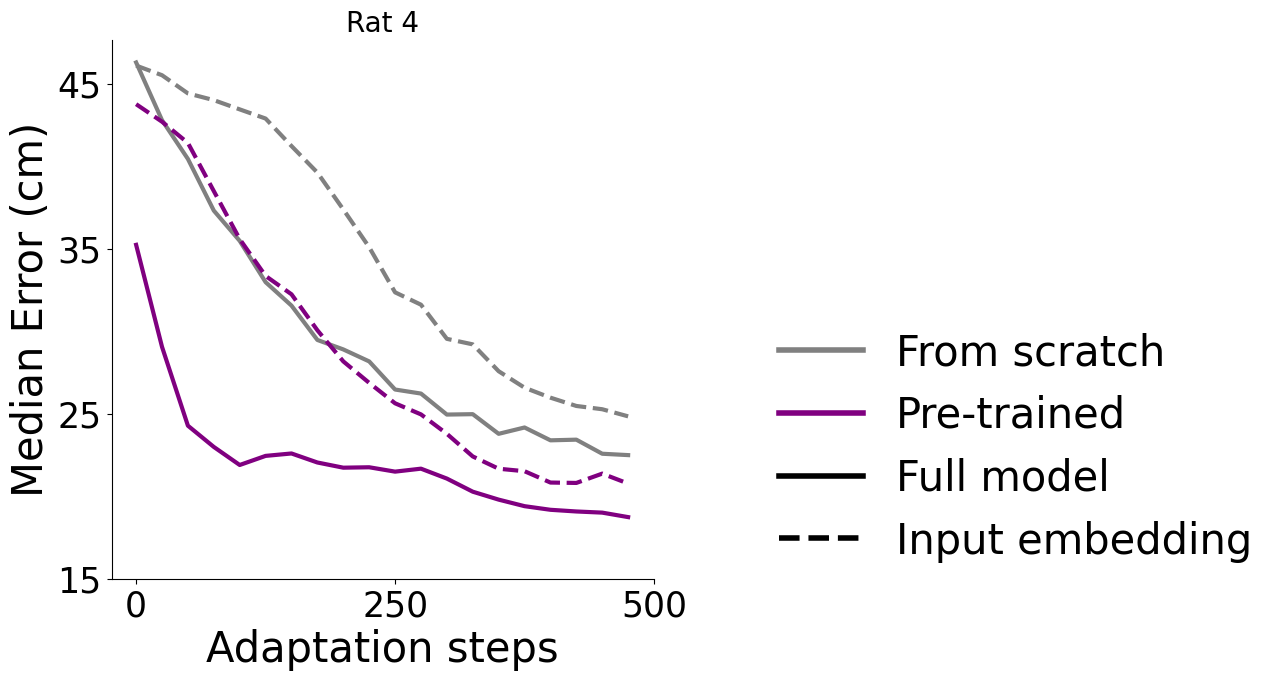
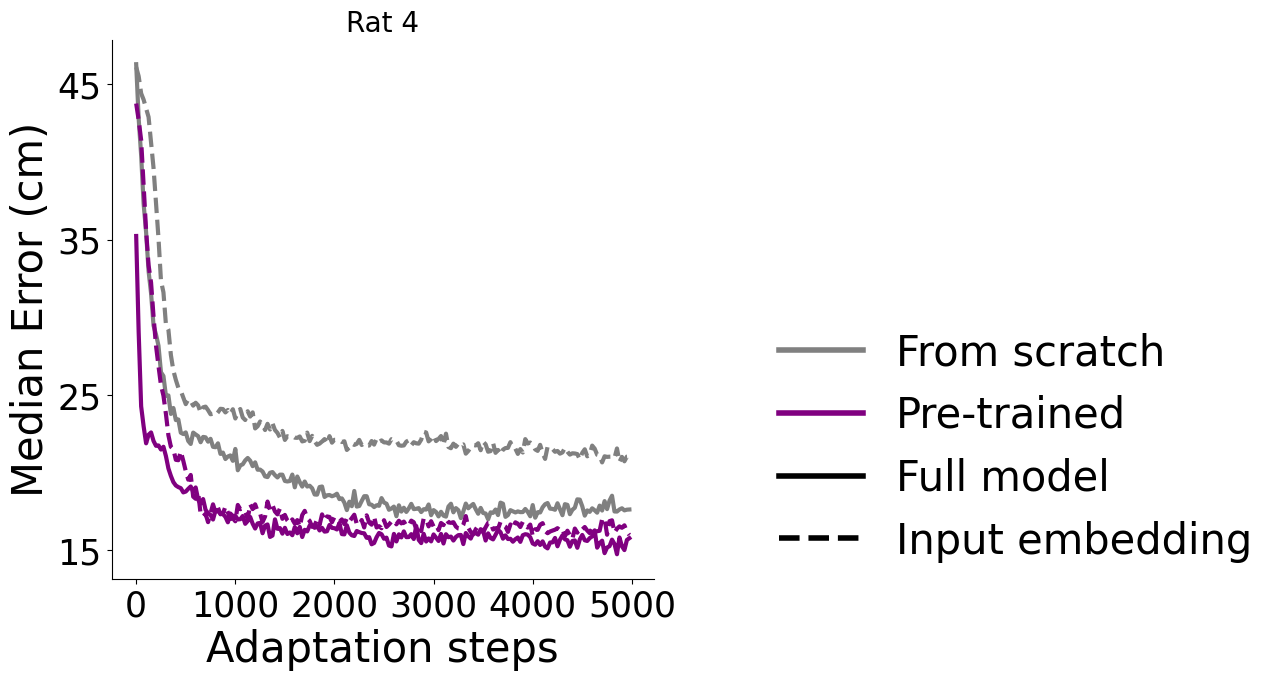
Adapt to an unseen dataset#
Here, 3 rats were used for pretraining, and rat #4 was used as a held-out test. The grey lines are from scratch training. We also tested fine-tuning the input or full model, as the diagram, left, describes. We measured the average time to adapt 100 steps (0.65 ± 0.13 sec) and 500 steps (3.07± 0.61 sec) on 40 repeated experiments.
[14]:
steps = 5000
yticks = np.arange(15, 55, 10)
xticks = np.arange(0, 6000, 1000)
plot(data)
panel, inset#
[15]:
steps = 500
yticks = np.arange(15, 55, 10)
xticks = np.arange(0, steps + 25, 25 * 10)
plot(data)