You can download and run the notebook locally:
Table S1-2#
[1]:
import joblib as jl
import matplotlib.pyplot as plt
import numpy as np
import pandas as pd
import scipy.stats
import seaborn as sns
import sklearn.metrics
from statsmodels.sandbox.stats.multicomp import get_tukey_pvalue
from statsmodels.stats.multicomp import pairwise_tukeyhsd
from statsmodels.stats.oneway import anova_oneway
[2]:
def anova_with_report(data):
    # One way ANOVA, helper function for formatting
    control = scipy.stats.f_oneway(*data)
    print(control)
    a = anova_oneway(
        data,
        use_var="equal",
    )
    assert np.isclose(a.pvalue, control.pvalue), (a.pvalue, control.pvalue)
    assert np.isclose(a.statistic, control.statistic)
    return f"F = {a.statistic}, p = {a.pvalue}\n\n    " + "\n    ".join(
        str(a).split("\n")
    )
[3]:
DATA = "../data/SupplTable1.h5"
Table S1: Consistency across subjects#
We compare the consistency across subjects of all available methods depicted in Figure 1:
[4]:
methods = [
    "cebra_10_b",
    "cebra_10_t",
    "pivae_10_w",
    "pivae_10_wo",
    "tsne",
    "umap",
    "autolfads",
]
[5]:
def subject_consistency(key):
    if key == "autolfads":
        autolfads_consistency = np.array(
            [
                [0.52405768, 0.54354575, 0.5984262],
                [0.61116595, 0.59024053, 0.747014],
                [0.68505602, 0.60948229, 0.57858312],
                [0.77841349, 0.78809085, 0.65031025],
            ]
        )
        return autolfads_consistency.flatten()
    else:
        data = (
            pd.read_hdf(DATA, key=key)
            .pivot_table(
                "train", columns="animal", aggfunc=lambda v: np.mean(np.array(v))
            )
            .agg(np.concatenate, axis=1)
            .item()
        )
        return data


def load_data(keys):
    return pd.DataFrame(
        [{"method": key, "metric": subject_consistency(key)} for key in keys]
    )
[6]:
data = load_data(methods)
anova_sup = scipy.stats.f_oneway(*data.metric.values)
data_explode = data.explode("metric")
data_explode.metric = data_explode.metric.astype(float)
data_explode.sort_values("metric")
posthoc_sup = pairwise_tukeyhsd(
    data_explode.metric.values, data_explode.method.values, alpha=0.05
)

print(
    f"""
# Subject Consistency

Anova:  {anova_sup}

Post Hoc test:

{posthoc_sup}
p-values: {posthoc_sup.pvalues}
"""
)

fig, ax = plt.subplots(1, 1, figsize=(8, 3))
sns.boxplot(data=data.explode("metric"), x="method", y="metric", ax=ax)
ax.set_xticklabels(ax.get_xticklabels(), rotation=45)
plt.show()
# Subject Consistency

Anova:  F_onewayResult(statistic=25.454720289784103, pvalue=1.9171102662989993e-16)

Post Hoc test:

     Multiple Comparison of Means - Tukey HSD, FWER=0.05
==============================================================
   group1      group2   meandiff p-adj   lower   upper  reject
--------------------------------------------------------------
  autolfads  cebra_10_b    0.301    0.0  0.1549  0.4472   True
  autolfads  cebra_10_t    0.129 0.1192 -0.0171  0.2752  False
  autolfads  pivae_10_w   0.1049 0.3219 -0.0412  0.2511  False
  autolfads pivae_10_wo  -0.1111 0.2569 -0.2572  0.0351  False
  autolfads        tsne   0.0369 0.9876 -0.1092   0.183  False
  autolfads        umap  -0.2312 0.0002 -0.3774 -0.0851   True
 cebra_10_b  cebra_10_t   -0.172 0.0108 -0.3181 -0.0258   True
 cebra_10_b  pivae_10_w  -0.1961 0.0021 -0.3423   -0.05   True
 cebra_10_b pivae_10_wo  -0.4121    0.0 -0.5582  -0.266   True
 cebra_10_b        tsne  -0.2641    0.0 -0.4103  -0.118   True
 cebra_10_b        umap  -0.5323    0.0 -0.6784 -0.3861   True
 cebra_10_t  pivae_10_w  -0.0241 0.9988 -0.1703   0.122  False
 cebra_10_t pivae_10_wo  -0.2401 0.0001 -0.3862  -0.094   True
 cebra_10_t        tsne  -0.0921 0.4808 -0.2383   0.054  False
 cebra_10_t        umap  -0.3603    0.0 -0.5064 -0.2141   True
 pivae_10_w pivae_10_wo   -0.216 0.0005 -0.3621 -0.0698   True
 pivae_10_w        tsne   -0.068 0.7953 -0.2142  0.0781  False
 pivae_10_w        umap  -0.3361    0.0 -0.4823   -0.19   True
pivae_10_wo        tsne    0.148 0.0453  0.0018  0.2941   True
pivae_10_wo        umap  -0.1202 0.1776 -0.2663   0.026  False
       tsne        umap  -0.2681    0.0 -0.4143  -0.122   True
--------------------------------------------------------------
p-values: [4.59895124e-07 1.19172320e-01 3.21851381e-01 2.56916326e-01
 9.87615917e-01 1.56137128e-04 1.08400031e-02 2.14410677e-03
 1.95687910e-11 1.08622421e-05 0.00000000e+00 9.98789909e-01
 7.74329488e-05 4.80794973e-01 2.26967911e-09 5.03580925e-04
 7.95286134e-01 2.02236538e-08 4.52509652e-02 1.77597319e-01
 7.76919683e-06]
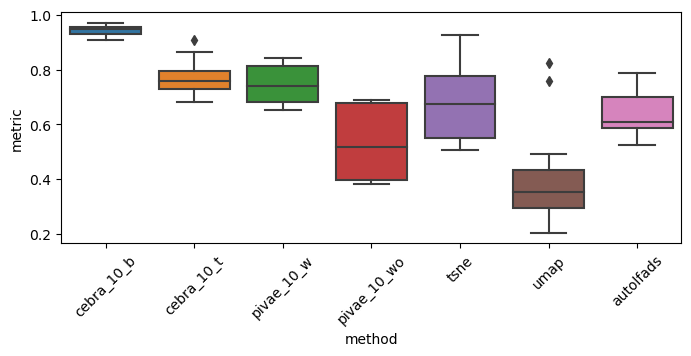
Table S2: Decoding performance#
We compare the methods trained using label information (CEBRA-behavior and all considered variants of piVAE) and the self-/un-supervised methods trained without using labels (CEBRA-time, t-SNE, UMAP, autoLFADS, and the PCA baseline).
[7]:
supervised_methods = [
    "cebra_10_b",
    "pivae_1_w",
    "pivae_10_w",
    "pivae_1_wo",
    "pivae_10_wo",
]
supervised_methods_decoding = [
    "cebra_10_b",
    "pivae_1_mcmc",
    "pivae_10_mcmc",
    "pivae_1_wo",
    "pivae_10_wo",
]
unsupervised_methods = ["cebra_10_t", "tsne", "umap", "autolfads", "pca"]
[8]:
# for decoding
# avg over seeds
#    (# animals x # of CV runs) --> 4 x 3 --> 12


def decoding(key, animal=0):
    data = pd.read_hdf(DATA, key=key)
    metric = "test_position_error"
    if metric + "_svm" in data.columns:
        metric = metric + "_svm"
    data = data.pivot_table(
        metric, index="animal", columns="seed", aggfunc=lambda v: np.mean(np.array(v))
    ).agg(np.array, axis=1)

    if animal is None:
        return data.agg(np.concatenate, axis=0)
    else:
        return data.loc[animal]


def load_data(keys, animal):
    return pd.DataFrame(
        [{"method": key, "metric": decoding(key, animal)} for key in keys]
    ).copy()


def report_supervised(animal):
    data = load_data(supervised_methods_decoding, animal)
    anova = anova_with_report(data.metric.values)
    data_explode = data.explode("metric")
    data_explode.metric = data_explode.metric.astype(float)
    posthoc_sup = pairwise_tukeyhsd(
        data_explode.metric.values, data_explode.method.values, alpha=0.05
    )
    return anova, posthoc_sup, data


def report_unsupervised(animal):
    data = load_data(unsupervised_methods, animal)
    data.loc[(data["method"] == "pca"), "metric"] = data[(data["method"] == "pca")][
        "metric"
    ].apply(lambda v: v.repeat(10))
    data_explode = data.explode("metric")
    data_explode.metric = data_explode.metric.astype(float)
    anova = anova_with_report(data.metric.values)
    posthoc = pairwise_tukeyhsd(
        data_explode.metric.values, data_explode.method.values, alpha=0.05
    )
    return anova, posthoc_sup, data


def plot_overview(sup_data, unsup_data):
    fig, axes = plt.subplots(1, 2, figsize=(8, 3))
    sns.boxplot(data=sup_data.explode("metric"), x="method", y="metric", ax=axes[0])
    sns.boxplot(data=unsup_data.explode("metric"), x="method", y="metric", ax=axes[1])
    axes[0].set_title("Supervised")
    axes[1].set_title("Unsupervised")
    for ax in axes:
        ax.set_xticklabels(ax.get_xticklabels(), rotation=45)
    plt.tight_layout()
    plt.show()
Rat 1 (Achilles), Anova and post-hoc test on supervised methods#
[9]:
anova, posthoc, sup_data = report_supervised(0)

print(anova)
print("\n\n")
print(posthoc)
print("p-values: ", ", ".join(map(str, posthoc.pvalues)))
F_onewayResult(statistic=130.8489167329169, pvalue=3.584864370350153e-24)
F = 130.84891673291744, p = 3.584864370349843e-24

    statistic = 130.84891673291744
    pvalue = 3.584864370349843e-24
    df = (4.0, 45.0)
    df_num = 4.0
    df_denom = 45.0
    nobs_t = 50.0
    n_groups = 5
    means = [0.05458863 0.12718886 0.11124251 0.35219591 0.16122803]
    nobs = [10. 10. 10. 10. 10.]
    vars_ = [4.48646101e-06 7.35450406e-05 8.94713254e-04 8.68539373e-04
         3.07831069e-03]
    use_var = equal
    welch_correction = True
    tuple = (130.84891673291744, 3.584864370349843e-24)


       Multiple Comparison of Means - Tukey HSD, FWER=0.05
=================================================================
    group1        group2    meandiff p-adj   lower  upper  reject
-----------------------------------------------------------------
   cebra_10_b pivae_10_mcmc   0.0567 0.0018  0.0168 0.0965   True
   cebra_10_b   pivae_10_wo   0.1066    0.0  0.0668 0.1465   True
   cebra_10_b  pivae_1_mcmc   0.0726    0.0  0.0327 0.1125   True
   cebra_10_b    pivae_1_wo   0.2976    0.0  0.2577 0.3375   True
pivae_10_mcmc   pivae_10_wo     0.05 0.0075  0.0101 0.0898   True
pivae_10_mcmc  pivae_1_mcmc   0.0159 0.7863 -0.0239 0.0558  False
pivae_10_mcmc    pivae_1_wo    0.241    0.0  0.2011 0.2808   True
  pivae_10_wo  pivae_1_mcmc   -0.034 0.1269 -0.0739 0.0058  False
  pivae_10_wo    pivae_1_wo    0.191    0.0  0.1511 0.2308   True
 pivae_1_mcmc    pivae_1_wo    0.225    0.0  0.1851 0.2649   True
-----------------------------------------------------------------
p-values:  0.001847501003341745, 1.299383645125829e-08, 4.869827063835874e-05, 0.0, 0.007474720241527288, 0.786269324603824, 0.0, 0.12689021533421352, 0.0, 0.0
Rat 1 (Achilles), Anova and post-hoc test on unsupervised methods#
[10]:
anova, posthoc, unsup_data = report_unsupervised(0)

print(anova)
print("\n\n")
print(posthoc)
print("p-values: ", ", ".join(map(str, posthoc.pvalues)))
F_onewayResult(statistic=1983.0064715111755, pvalue=5.950793013875487e-50)
F = 1983.006471511298, p = 5.950793013867255e-50

    statistic = 1983.006471511298
    pvalue = 5.950793013867255e-50
    df = (4.0, 45.0)
    df_num = 4.0
    df_denom = 45.0
    nobs_t = 50.0
    n_groups = 5
    means = [0.04710335 0.06233259 0.05585373 0.06659485 0.22385401]
    nobs = [10. 10. 10. 10. 10.]
    vars_ = [1.49161239e-06 4.27979600e-07 4.56283808e-07 1.37750285e-04
         0.00000000e+00]
    use_var = equal
    welch_correction = True
    tuple = (1983.006471511298, 5.950793013867255e-50)


     Multiple Comparison of Means - Tukey HSD, FWER=0.05
==============================================================
   group1      group2   meandiff p-adj   lower   upper  reject
--------------------------------------------------------------
  autolfads  cebra_10_b    0.301    0.0  0.1549  0.4472   True
  autolfads  cebra_10_t    0.129 0.1192 -0.0171  0.2752  False
  autolfads  pivae_10_w   0.1049 0.3219 -0.0412  0.2511  False
  autolfads pivae_10_wo  -0.1111 0.2569 -0.2572  0.0351  False
  autolfads        tsne   0.0369 0.9876 -0.1092   0.183  False
  autolfads        umap  -0.2312 0.0002 -0.3774 -0.0851   True
 cebra_10_b  cebra_10_t   -0.172 0.0108 -0.3181 -0.0258   True
 cebra_10_b  pivae_10_w  -0.1961 0.0021 -0.3423   -0.05   True
 cebra_10_b pivae_10_wo  -0.4121    0.0 -0.5582  -0.266   True
 cebra_10_b        tsne  -0.2641    0.0 -0.4103  -0.118   True
 cebra_10_b        umap  -0.5323    0.0 -0.6784 -0.3861   True
 cebra_10_t  pivae_10_w  -0.0241 0.9988 -0.1703   0.122  False
 cebra_10_t pivae_10_wo  -0.2401 0.0001 -0.3862  -0.094   True
 cebra_10_t        tsne  -0.0921 0.4808 -0.2383   0.054  False
 cebra_10_t        umap  -0.3603    0.0 -0.5064 -0.2141   True
 pivae_10_w pivae_10_wo   -0.216 0.0005 -0.3621 -0.0698   True
 pivae_10_w        tsne   -0.068 0.7953 -0.2142  0.0781  False
 pivae_10_w        umap  -0.3361    0.0 -0.4823   -0.19   True
pivae_10_wo        tsne    0.148 0.0453  0.0018  0.2941   True
pivae_10_wo        umap  -0.1202 0.1776 -0.2663   0.026  False
       tsne        umap  -0.2681    0.0 -0.4143  -0.122   True
--------------------------------------------------------------
p-values:  4.5989512431621193e-07, 0.11917232008530076, 0.3218513805429045, 0.25691632555266564, 0.9876159168285589, 0.00015613712753770326, 0.010840003137932097, 0.0021441067703942274, 1.956879103204301e-11, 1.0862242120657228e-05, 0.0, 0.998789909385646, 7.743294878004292e-05, 0.48079497324498466, 2.2696791113219206e-09, 0.0005035809251053847, 0.7952861342308782, 2.0223653751649806e-08, 0.045250965160721246, 0.17759731861515216, 7.769196829099378e-06
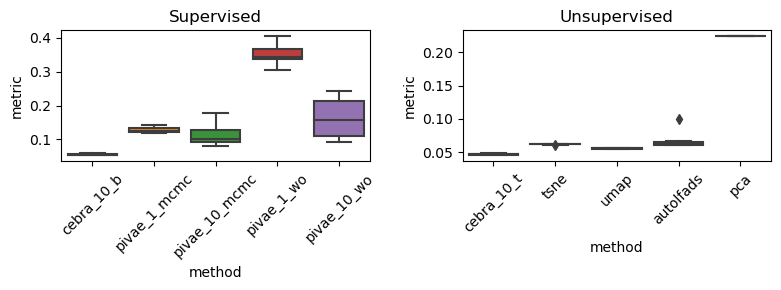
Rat 1 (Achilles), overview plot#
(Not shown in the paper)
[11]:
plot_overview(sup_data, unsup_data)
All Rats, Anova and post-hoc test on supervised methods#
[12]:
anova, posthoc, sup_data = report_supervised(None)

print(anova)
print("\n\n")
print(posthoc)
print("p-values: ", ", ".join(map(str, posthoc.pvalues)))
F_onewayResult(statistic=55.17031672006308, pvalue=4.694077971736457e-31)
F = 55.170316720063056, p = 4.694077971736618e-31

    statistic = 55.170316720063056
    pvalue = 4.694077971736618e-31
    df = (4.0, 195.0)
    df_num = 4.0
    df_denom = 195.0
    nobs_t = 200.0
    n_groups = 5
    means = [0.13529156 0.30867451 0.14618708 0.40349386 0.2895263 ]
    nobs = [40. 40. 40. 40. 40.]
    vars_ = [0.00385949 0.01914409 0.00143575 0.00413979 0.01880184]
    use_var = equal
    welch_correction = True
    tuple = (55.170316720063056, 4.694077971736618e-31)


       Multiple Comparison of Means - Tukey HSD, FWER=0.05
=================================================================
    group1        group2    meandiff p-adj   lower  upper  reject
-----------------------------------------------------------------
   cebra_10_b pivae_10_mcmc   0.0109 0.9872  -0.049 0.0708  False
   cebra_10_b   pivae_10_wo   0.1542    0.0  0.0943 0.2142   True
   cebra_10_b  pivae_1_mcmc   0.1734    0.0  0.1134 0.2333   True
   cebra_10_b    pivae_1_wo   0.2682    0.0  0.2083 0.3281   True
pivae_10_mcmc   pivae_10_wo   0.1433    0.0  0.0834 0.2033   True
pivae_10_mcmc  pivae_1_mcmc   0.1625    0.0  0.1026 0.2224   True
pivae_10_mcmc    pivae_1_wo   0.2573    0.0  0.1974 0.3172   True
  pivae_10_wo  pivae_1_mcmc   0.0191 0.9041 -0.0408 0.0791  False
  pivae_10_wo    pivae_1_wo    0.114    0.0   0.054 0.1739   True
 pivae_1_mcmc    pivae_1_wo   0.0948 0.0002  0.0349 0.1548   True
-----------------------------------------------------------------
p-values:  0.9872326031852133, 2.460746051369256e-10, 1.247890679678676e-12, 0.0, 4.109283691100529e-09, 2.6964652732885952e-11, 0.0, 0.9041012894236118, 4.1859577109004675e-06, 0.00020598765774881844
All Rats, Anova and post-hoc test on unsupervised methods#
[13]:
anova, posthoc, unsup_data = report_unsupervised(None)

print(anova)
print("\n\n")
print(posthoc)
print("p-values: ", ", ".join(map(str, posthoc.pvalues)))
F_onewayResult(statistic=14.746848806860859, pvalue=1.523730417925221e-10)
F = 14.746848806860855, p = 1.523730417925221e-10

    statistic = 14.746848806860855
    pvalue = 1.523730417925221e-10
    df = (4.0, 195.0)
    df_num = 4.0
    df_denom = 195.0
    nobs_t = 200.0
    n_groups = 5
    means = [0.11689811 0.1959747  0.18944162 0.24828243 0.30024827]
    nobs = [40. 40. 40. 40. 40.]
    vars_ = [0.00354796 0.01188905 0.01183249 0.02293898 0.01386443]
    use_var = equal
    welch_correction = True
    tuple = (14.746848806860855, 1.523730417925221e-10)


     Multiple Comparison of Means - Tukey HSD, FWER=0.05
==============================================================
   group1      group2   meandiff p-adj   lower   upper  reject
--------------------------------------------------------------
  autolfads  cebra_10_b    0.301    0.0  0.1549  0.4472   True
  autolfads  cebra_10_t    0.129 0.1192 -0.0171  0.2752  False
  autolfads  pivae_10_w   0.1049 0.3219 -0.0412  0.2511  False
  autolfads pivae_10_wo  -0.1111 0.2569 -0.2572  0.0351  False
  autolfads        tsne   0.0369 0.9876 -0.1092   0.183  False
  autolfads        umap  -0.2312 0.0002 -0.3774 -0.0851   True
 cebra_10_b  cebra_10_t   -0.172 0.0108 -0.3181 -0.0258   True
 cebra_10_b  pivae_10_w  -0.1961 0.0021 -0.3423   -0.05   True
 cebra_10_b pivae_10_wo  -0.4121    0.0 -0.5582  -0.266   True
 cebra_10_b        tsne  -0.2641    0.0 -0.4103  -0.118   True
 cebra_10_b        umap  -0.5323    0.0 -0.6784 -0.3861   True
 cebra_10_t  pivae_10_w  -0.0241 0.9988 -0.1703   0.122  False
 cebra_10_t pivae_10_wo  -0.2401 0.0001 -0.3862  -0.094   True
 cebra_10_t        tsne  -0.0921 0.4808 -0.2383   0.054  False
 cebra_10_t        umap  -0.3603    0.0 -0.5064 -0.2141   True
 pivae_10_w pivae_10_wo   -0.216 0.0005 -0.3621 -0.0698   True
 pivae_10_w        tsne   -0.068 0.7953 -0.2142  0.0781  False
 pivae_10_w        umap  -0.3361    0.0 -0.4823   -0.19   True
pivae_10_wo        tsne    0.148 0.0453  0.0018  0.2941   True
pivae_10_wo        umap  -0.1202 0.1776 -0.2663   0.026  False
       tsne        umap  -0.2681    0.0 -0.4143  -0.122   True
--------------------------------------------------------------
p-values:  4.5989512431621193e-07, 0.11917232008530076, 0.3218513805429045, 0.25691632555266564, 0.9876159168285589, 0.00015613712753770326, 0.010840003137932097, 0.0021441067703942274, 1.956879103204301e-11, 1.0862242120657228e-05, 0.0, 0.998789909385646, 7.743294878004292e-05, 0.48079497324498466, 2.2696791113219206e-09, 0.0005035809251053847, 0.7952861342308782, 2.0223653751649806e-08, 0.045250965160721246, 0.17759731861515216, 7.769196829099378e-06
[14]:
plot_overview(sup_data, unsup_data)
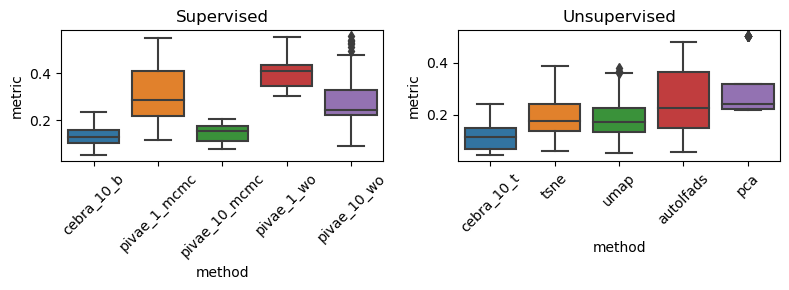
Overview of the decoding performance#
[15]:
rat = 0
print(f"Rat {rat}")
for key in supervised_methods_decoding:
    print(
        f"\t{key}\t{decoding(key, animal=rat).mean():.5f} +/- {decoding(key, animal=rat).std():.5f}"
    )
Rat 0
        cebra_10_b      0.05459 +/- 0.00201
        pivae_1_mcmc    0.12719 +/- 0.00814
        pivae_10_mcmc   0.11124 +/- 0.02838
        pivae_1_wo      0.35220 +/- 0.02796
        pivae_10_wo     0.16123 +/- 0.05264